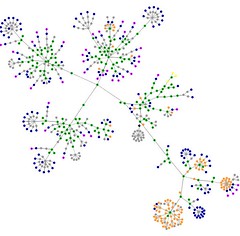
This site is great for developers, it creates a graphical representation of your website. It's like looking into the soul of your website and spilling your guts. All you do is enter your website URL and it will instantly start creating a graphic. The colors in the graphic represent the links, tables, and other html tags you have in the website. This gives a developer a picture of how many html tags they have in their code and they can make changes accordingly.
Here is a graphic of one of my sites:

What do the colors mean?
blue: for links (the A tag)
red: for tables (TABLE, TR and TD tags)
green: for the DIV tag
violet: for images (the IMG tag)
yellow: for forms (FORM, INPUT, TEXTAREA, SELECT and OPTION tags)
orange: for linebreaks and blockquotes (BR, P, and BLOCKQUOTE tags)
black: the HTML tag, the root node
gray: all other tags
The site is: http://www.aharef.info/static/htmlgraph/
You can see my site graphics on my Flickr page.
Here is a graphic of one of my sites:

What do the colors mean?
blue: for links (the A tag)
red: for tables (TABLE, TR and TD tags)
green: for the DIV tag
violet: for images (the IMG tag)
yellow: for forms (FORM, INPUT, TEXTAREA, SELECT and OPTION tags)
orange: for linebreaks and blockquotes (BR, P, and BLOCKQUOTE tags)
black: the HTML tag, the root node
gray: all other tags
The site is: http://www.aharef.info/static/htmlgraph/
You can see my site graphics on my Flickr page.
If you create a graphic for your website, add it to Flickr and tag it as websitesasgraphs. You can view other website graphics by searching for that tag.
If you've used this service before post the graphic url below and share it with us.


No comments:
Post a Comment